
#6: Caveman Brain and Decision Dominance
Troops in contact. 10-dimensional calculus. Ten-thousand-year-old hardware.

Back in 2020, I was instructing a student pilot in a remotely piloted aircraft when I heard a call for potential “troops in contact.” This means folks on the ground may be get shot at. I took controls from him and started looking through my sensor — a narrow field of view, high fidelity, locked onto a specific area, ie: the soda straw. Meanwhile, a fighter on station sees the full picture from altitude.
He sees a group of nefarious actors congregating outside my field of view. I slew the camera and count the number of weapons. Who had better situational awareness (SA)?
It doesn’t matter. What matters is: should the convoy going to press forward or not? And neither of us could answer alone. But what if it were possible to design a system that leveraged human senses and could capture information at high resolution?
Computers can process thousands of dimensions but can't tell you which ones matter. Humans know what matters but have limited bandwidth. We tried to close the gap.
Below is a crude visualization of an aircraft flying through altitude and heading bounds with a topdown view on the right. Ugly yes, but able to serve as a primitive for our design, also yes.
The Caveman Brain
Many have admired the problem of information overload in the modern age. Our brain’s hardware was designed for survival 10,000 years ago and excels in pattern recognition, spatial awareness, threat detection. When under stress, deliberate reasoning, sequential analysis — becomes less available, not more. (Arnsten, 2009, on stress and prefrontal cortex availability is the clinical grounding here.) We all know this. What you may not have considered is a way to depict dense high-dimensional data in a picture can help close the gap.
Shannon formalized the ceiling in 1948: every channel has a fixed capacity, and past that capacity, more input degrades performance rather than improving it. The human visual system is a channel. The question is not how to put more on the screen. It is how to put less without losing anything that matters.
This is what I call decision density: the number of meaningful choices a display forces per unit of operator attention. Get it right and you multiply human judgment. Get it wrong and you’ve built an expensive machine that no one can effectively supervise.
The Math
The starting point is Principal Component Analysis. PCA takes highly dimensional data — think thousands of variables — and produces an ordered list of the directions that carry the most variance. Not all dimensions are created equal. The first principal component explains the most information. The second explains the most of what’s left.
The useful property: diminishing returns kicks in fast. In most real-world datasets, the first two or three components capture 80–90% of the meaningful structure. The rest is noise, redundancy, or detail that doesn’t drive decisions at speed. Furthermore, in the following example we decompose hundreds of variables into 10 PCAs.
Applied to sensor data, the question becomes: if you could only give the operator six numbers instead of a thousand parameters, which six carry the most information? PCA finds those six. They’re orthogonal — independent of each other, no redundancy — which means the operator can read each one without correcting for the others.
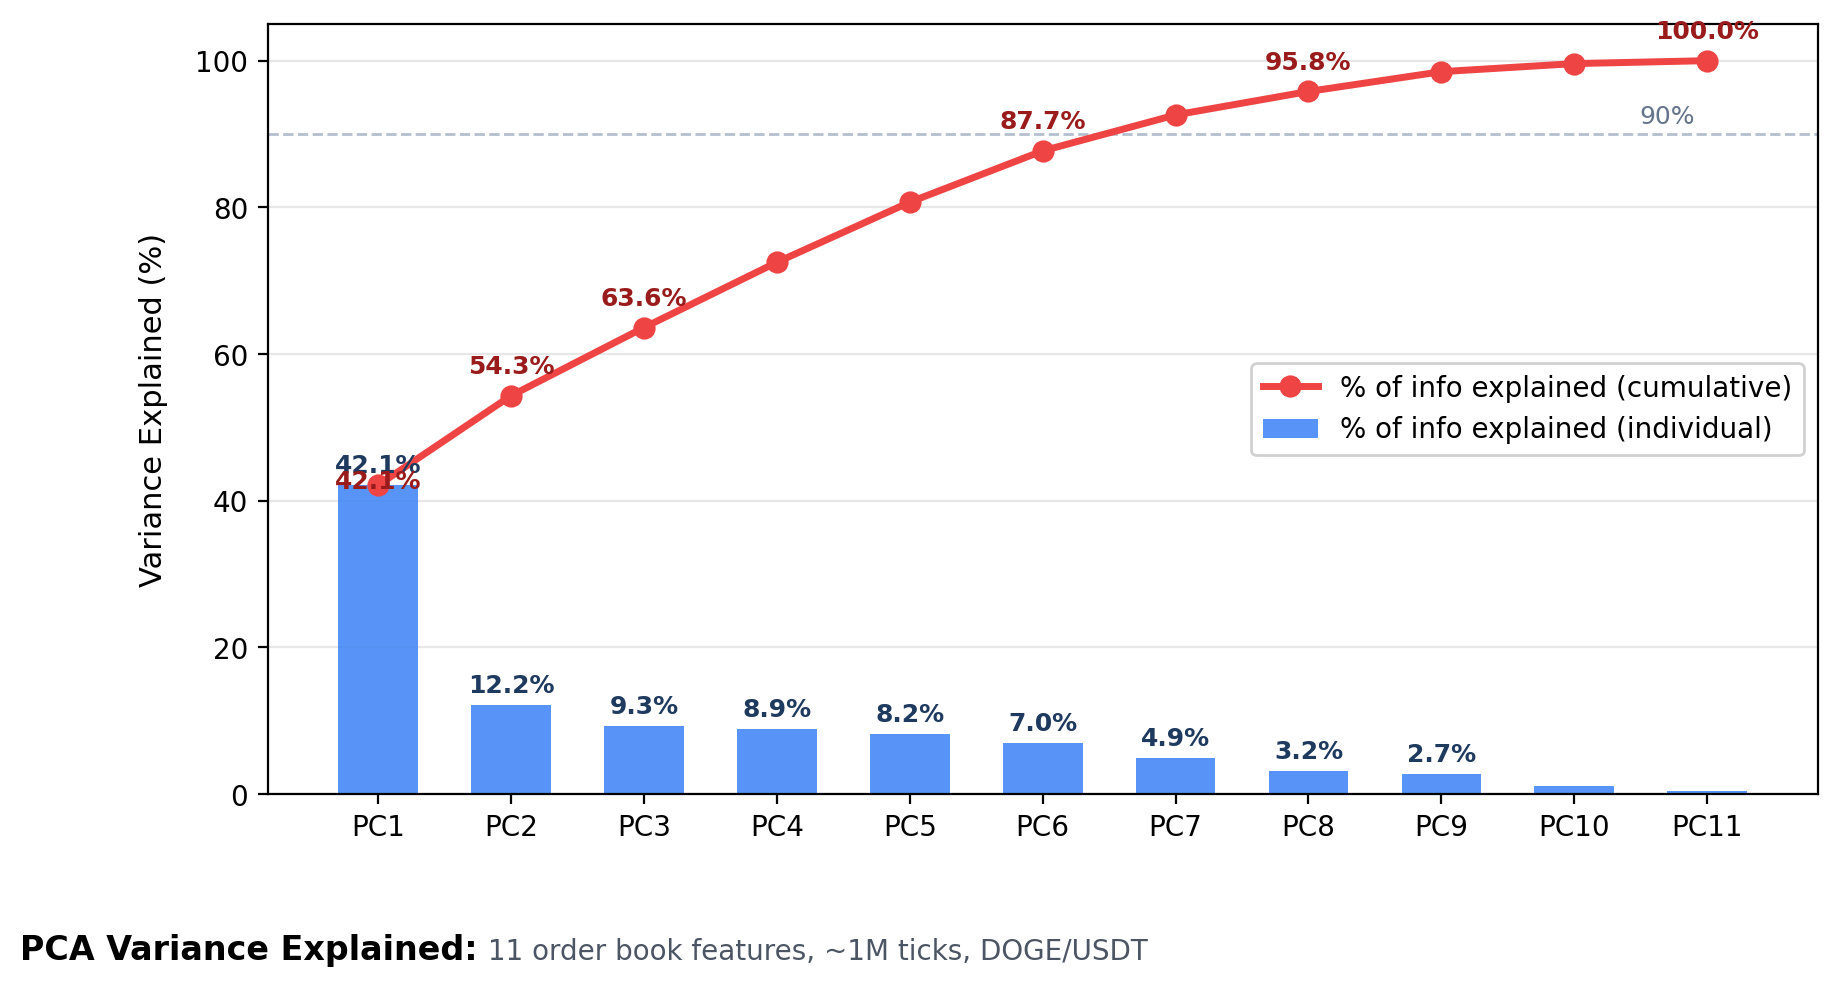
Hundreds of variables are now in 10 PCAs. But more importantly, we see that we get 60+% of information at 3. Meaning, a 3D display like we had before is a great tool.
Testing it Live
I needed to know if this approach was specific to aircraft or solving something more general. I needed a live, adversarial, highly dimensional environment to test it. Combat missions don’t run on weekends. Financial markets do.
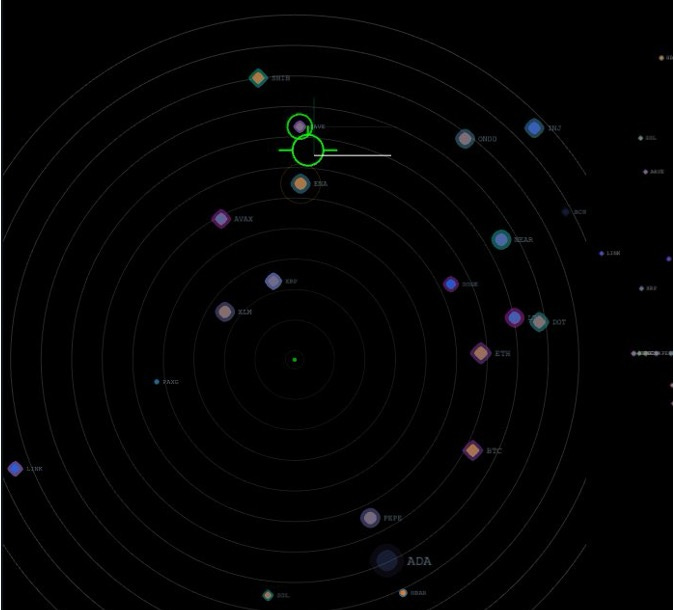
Cryptocurrency specifically — no live trades, no financial advice, not a recommendation — just the data structure. A live order book with 22 instruments updating at millisecond intervals has the same fundamental architecture as an autonomous aircraft sensor suite: more variables than any human processes at speed, an adversary on the other side, a display that determines whether you lead the tempo or chase it.
I built the display. By making a lot of mistakes first, I can save you time.
Here’s what didn’t work first:
• Lines between dots. First thing I considered and total dud. Can’t see what’s connecting without close inspection, which defeats the purpose.
• Everything a spectrum. PCA is not binary, but brains cannot tell the difference between 4Hz and 8Hz blink. We set threshold values for PCA 4+.
• Movement too fast. The caveman brain reads spatial change as threat. Instruments updating faster than ~250ms triggered urgency without signal.
• All the colors. We tried shapes and more colors. This was max distinguishable.
Unused Human RAM
Here’s something that doesn’t get said enough about remotely piloted operations: the pilot has sensory bandwidth the manned pilot has already spent.
A fighter pilot uses their vestibular system, peripheral vision, the seat-of-the-pants feel of the aircraft — all of it processing continuously, all of it consuming cognitive bandwidth. The remotely piloted pilot has none of that. Usually framed as a disadvantage. I’d argue it’s unused RAM.
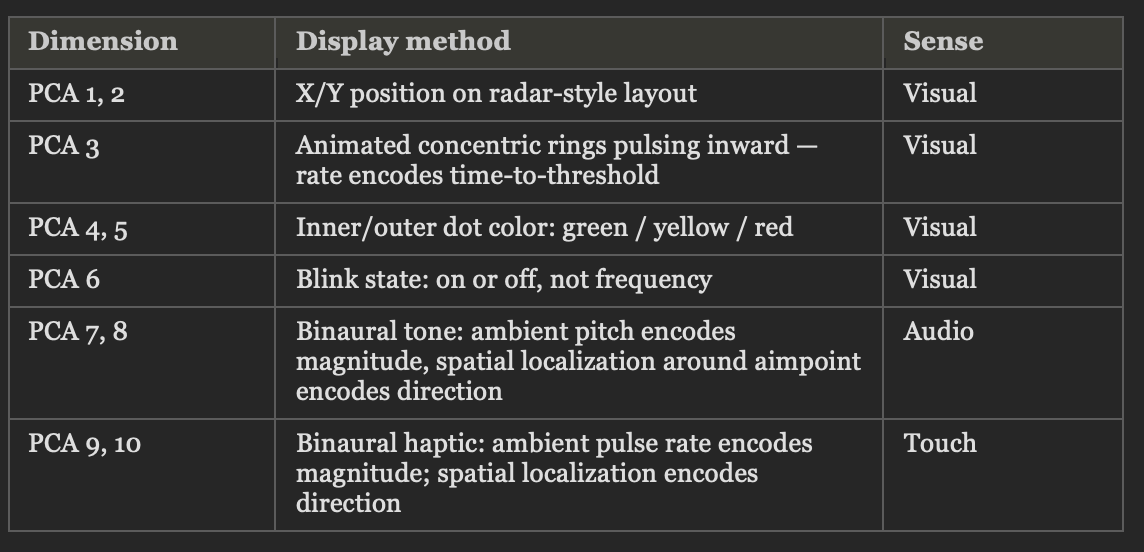
We tested two additional sensory channels alongside the visual display. The table below shows the full result: ten PCA dimensions, three sensory channels, zero hours of training required to execute on.
Here’s what worked:
• Three primary spatial dimensions. Size of dot smaller for “depth.”
• Color for 4x other dimensions. Organized in radial sections. Plus blinking or not.
• Audible pitch and vibration that would work for any headphone.
Here’s a breakdown of what you’re seeing above:
Want to Make One?
Whether you’re in a program office, a PE firm, or an ops center, the framework is the same. Three questions before you start building:
1. What is the decision space you’re responsible for? Not what data is available — at the point of decision, what do i need to see is true/false or “enough?”
2. How related are your dimensions? More related means more redundancy. PCA is the perfect ideal of this where all axes are perpendicular, but do your best.
3. What is the decision timeline? A 250ms decision window — unstable aircraft, live market — requires a fundamentally different display than a 45-second window — infil/exfil call, sourcing decision. Design for the worst-case tempo, not the average.
Once you have those three answers, you know what to compress / expand. But leveraging spatial and sensory input can squeeze out much more.
Applying this outside the cockpit
DARPA’s Mosaic Warfare concept frames national advantage as the ability to make better decisions faster than the adversary — at every level, across every domain. (DARPA, “DARPA Tiles Together a Vision of Mosaic Warfare,” 2017.) I’d take that one layer deeper: decision dominance at the national level is the aggregate of individual decision-making quality across every operator, analyst, and executive in the system.
Most programs build the algorithm first and the display last. I built this in a weekend. The methodology is not complicated. But it requires most to unlearn old habits.
What high-stakes decision is your team flying blind?
Disclaimer: The views expressed are those of the author and do not necessarily reflect the official policy or position of the Air Force, Space Force, Department of Defense, or U.S. Government.
I like how you framed decision density — especially in high-pressure environments.
From the delivery side, decisions operate inside constrained systems where options, ownership, and timing are already shaped before the conversation begins. The display layer matters, but it doesn’t change where control sits or how trade-offs are actually made.
Curious how you think about that layer beyond information representation.