
#5: Can a Number Win a War?
Size is not everything. If anything, it’s a weakness.

“Three-quarters of the factors on which action in war is based are wrapped in a fog of greater or lesser uncertainty.” — Clausewitz
War is uncertain. Predicting outcomes takes more than modeling. You already knew that. But before I was a pilot, I was a math major. In that world, uncertainty is not only usable — it is a number. So, I couldn’t stop myself from trying a calculation. This week, I looked at 97 wars across 198 years to see how well the most cited mathematical model of combat holds up against reality.
If your adversary’s military is larger, I call you David & Goliath. Your are not doomed.
The model
In 1916, Frederick Lanchester published a set of equations to describe modern armed conflict, later called his Square Law. The model says each unit can engage any opposing unit, so a force’s total firepower scales with its size, but its advantage in surviving enemy fire scales with the square of its size. Translated to math:
For:
α = effectiveness of each A unit against B (kills per unit per time), and
β = effectiveness of each B unit against A
Equal-quality forces α = β.
In English: the bigger your force, the faster you destroy the enemy and the slower you take casualties. A force twice as large does not have twice the advantage — it has four times the advantage. Whoever has more troops wins, assuming both sides fight with equal skill. Business strategists borrowed this model. Defense acquisition offices embedded it in cost calculations. It has a satisfying elegance.
I wanted to know if it was true.
To test it, I used three of the most widely-used academic conflict datasets in the field — compiled over decades by researchers at the Peace Research Institute Oslo and the Correlates of War Project, the closest thing the field has to a standardized record of conflict since 1816. I built a matched sample of wars where I had the force sizes on both sides and a clear outcome. After filtering for wars with unambiguous results and successful data matches on both sides, I had 97 interstate wars to test against.
The chart below shows the win rate for the larger force at each level of size advantage. The multiple is the size of Goliath relative to David. The 1.5–3x band covers all battles where Goliath is 1.5 to 3 times larger. The first thing that jumped out is highlighted in orange: the greatest win rate is not when you have the greatest numerical advantage. Not even close.
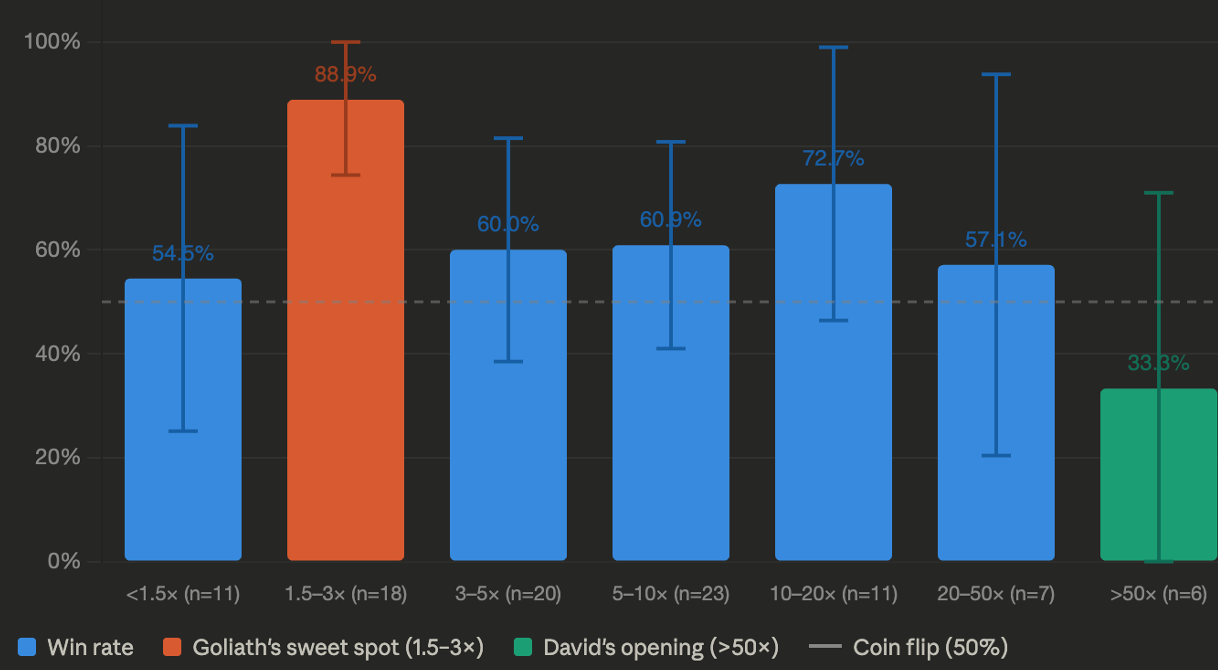
Source: COW MID v4.03, COW NMC v4.0. Interstate wars 1816–2014 with clear outcomes. Error bars show 95% confidence intervals. Dashed line = 50% baseline (coin flip).
It’s because we’re presenting a false proxy. Force size in this dataset is all military personnel across all branches. Unless this is an Avengers battle, the odds that all of army A fights all of army B in a single conflict is near 0%. But there’s something more interesting here than a bad data problem.
If it was simply a matter of not accounting for excess supply, the other bands would all be roughly blue — near the coin flip line. But they’re not. At the extreme end, having more forces relative to your adversary actually appears to disadvantage you. Think the Vietnam War. Think Thermopylae. Many possible explanations: armies may be harder to coordinate at that scale, a commander’s attention gets divided too far, multi-front exhaustion sets in.
The twist
Like shooting the moon in a game of hearts, it seems that if you are overmatched, you have better odds fighting on terms with a heavy numerical disadvantage than a mild one. I envision a team of Navy SEALs. That’s what the model tells us — but is it out to lunch?
To measure the model’s predictive strength I used AUC — area under the ROC curve, or the rate of true positives for a given false positive rate. Higher is better. A coin flip is 0.5. A perfect model is 1.0. Using the ratio of forces gives an AUC of 0.577. Lame… kind of.
It’s a bad news story for a data analyst trying to predict an outcome. But it is a good news story for a commander in a nation far smaller than its adversary. Although we can’t claim you’ll win, we have no evidence that Goliath will either. If anything, the model shows David has an edge at the extremes. But is it real?
Russia lost to Estonia in 1920 at a 191:1 force ratio. Germany lost to Finland and Bulgaria in 1945 at ratios above 130:1. It has happened and within this dataset it’s legit. The problem is the sample size. An n of 6 is hardly enough to draw a conclusion. So: if you are the smallest kid on the block, be very cautiously optimistic. Your fate is not sealed.
What I saw
I’ll share a trend I noticed in combat. When I watched firefights develop in the Middle East, the victor was rarely obvious. But what I and the sensor operator often agreed upon is that we’d rather be on the side with the better position than the side with the numerical advantage. Terrain, time of day, the local population — all of it gets a vote. You can use it or be used by it.
What’s on paper and what’s on the ground are rarely the same.
The one thing we can say with some confidence: total army size alone will not win you a war. If anything, it could be a hindrance. I’ll keep tracking down what does make the difference, mostly through process of elimination. But if you’re outnumbered by your adversary, you should be less discouraged after reading this than before.
Disclaimer: The views expressed are those of the author and do not necessarily reflect the official policy or position of the Air Force, Space Force, Department of Defense, or U.S. Government.